
- Training
- Service
- Promotion
- Schedule
- Testing Center
- News
- Contact


Create rich, interactive reports with visual analytics at your fingertips—for free.
Access data from hundreds of supported on-premises and cloud-based sources, such as Dynamics 365, Salesforce, Azure SQL DB, Excel, and SharePoint. Ensure it’s always up to date with automated, incremental refreshes. Power BI Desktop enables you to develop deep, actionable insights for a broad range of scenarios.
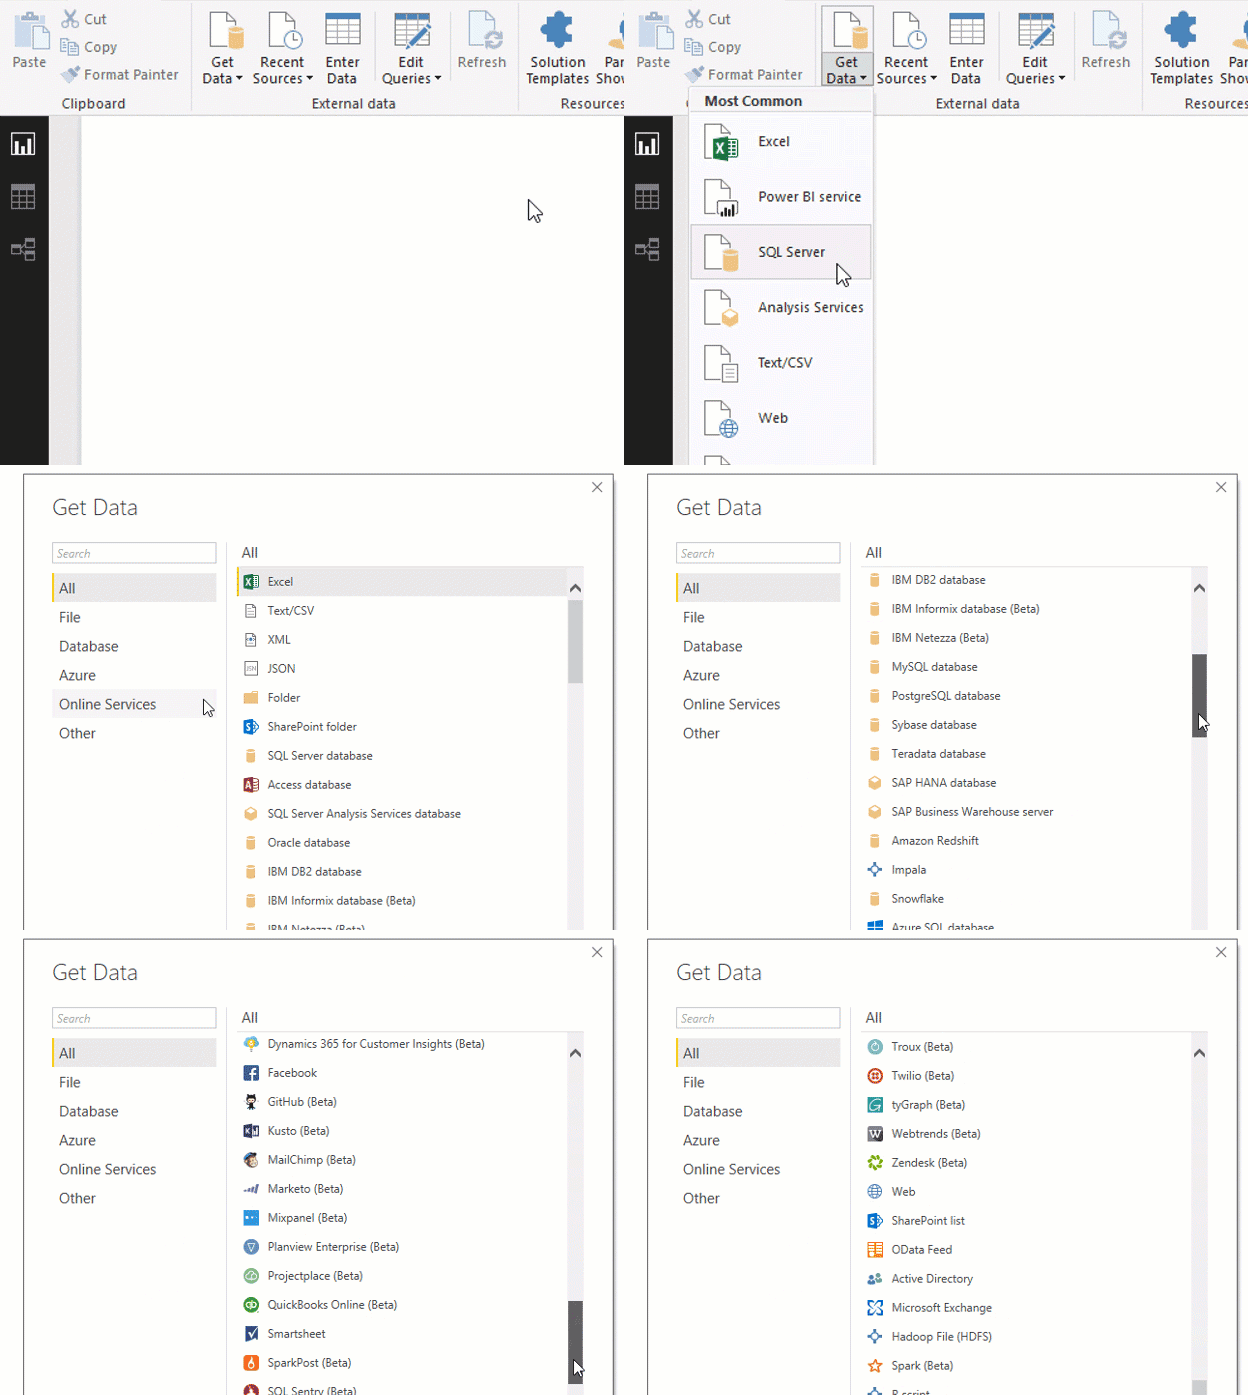
Data prep can take most of your time, but it doesn’t have to with data modeling tools. Reclaim hours in your day using the self-service Power Query experience familiar to millions of Excel users. Ingest, transform, integrate and enrich data in Power BI.
.png)
Dig deeper into data and find patterns you may have otherwise missed that lead to actionable insights. Use features like quick measures, grouping, forecasting, and clustering. Give advanced users full control over their model using powerful DAX formula language. If you’re familiar with Excel, you’ll feel at home in Power BI.
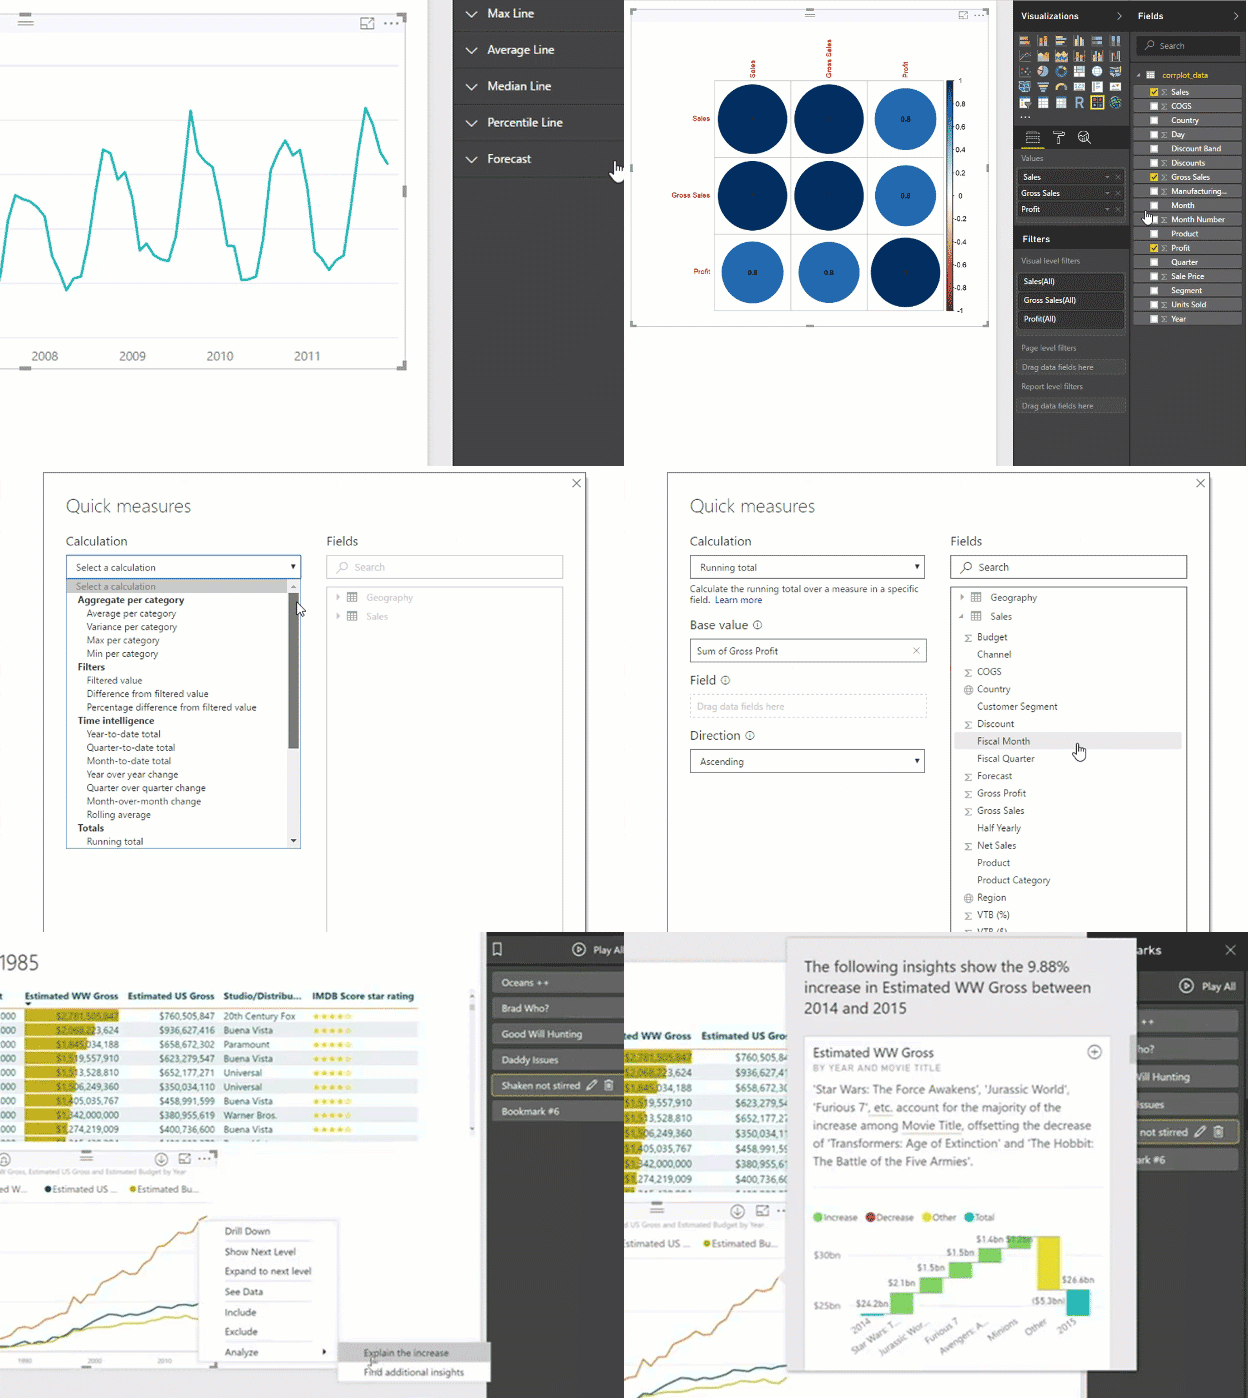
Create stunning reports with interactive data visualizations. Tell your data story using a drag-and-drop canvas and hundreds of modern data visuals from Microsoft and partners—or create your own, using the Power BI open source custom visuals framework. Design your report with theming, formatting, and layout tools.
.png)


