
- Training
- Service
- Promotion
- Schedule
- Testing Center
- News
- Contact


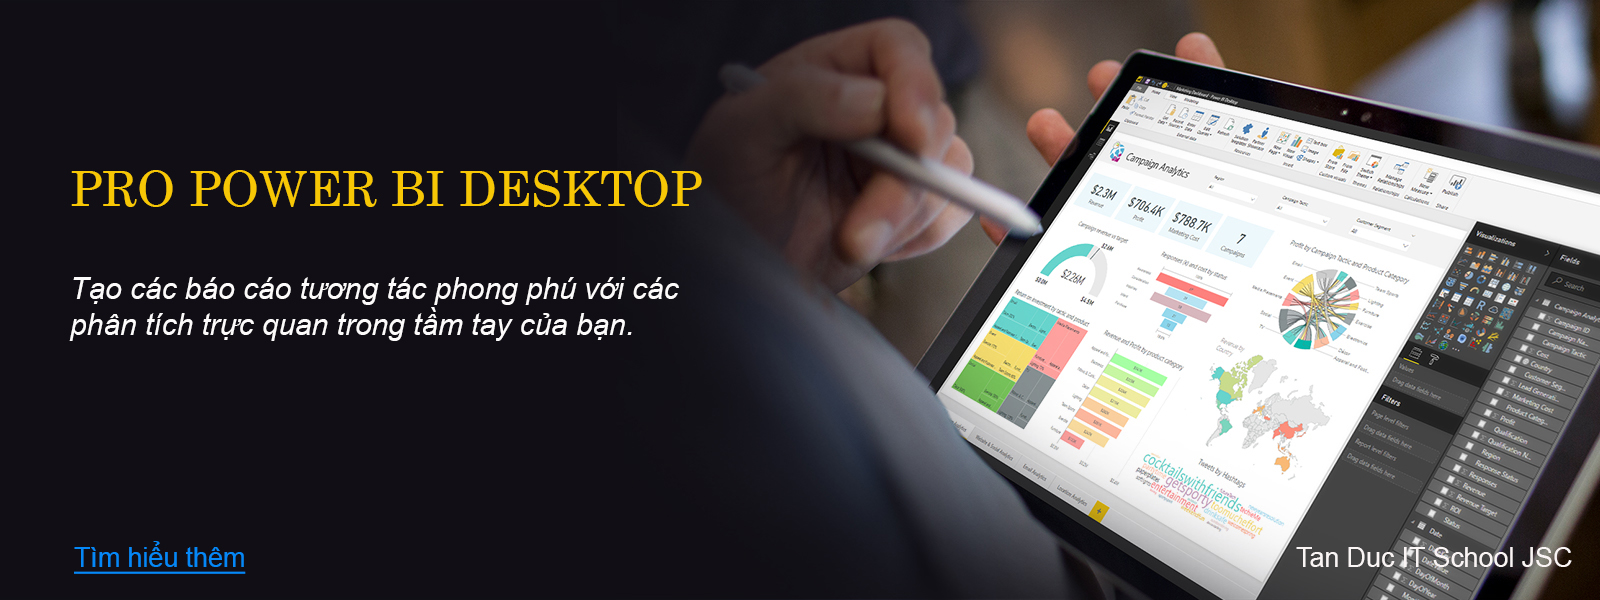
Create rich, interactive reports with visual analytics at your fingertips—for free.
Start date: 12 - 14 Aug, 2019
Time: 8h30am - 5h00pm
You’ll learn to create great-looking visualizations and let your audience have fun by interacting with the elegant and visually arresting output that you can now deliver. You can choose from a wide range of built-in and third-party visualization types so that your message is always enhanced. You’ll be able to deliver those results on the PC, on tablets, on smartphones, as well as share results via the cloud. Finally, this course helps you save time by preparing the underlying data correctly without needing an IT department to prepare it for you. Power BI Desktop will let your analyses speak for themselves.
Course Outline: view more
Registration: click here


