
- Training
- Service
- Promotion
- Schedule
- Testing Center
- News
- Contact


Power BI or Tableau? This comparison will help you decide which of these tools to use for your data science and analytics needs.
A good decision-making process finds a balance between decisiveness and due diligence, so conveying information quickly is highly valued in all kinds of businesses. This concept is at the heart of data visualization; often, a single graphic or chart can effortlessly show and explain what would otherwise have been thousands of numbers and words. You can create such charts using Business Intelligence tools such as Tableau and Microsoft Power BI.
In this article, we look at Power BI vs Tableau, exploring their similarities and differences, as well as their pros and cons. After reading, you should have an idea of which is right for your needs.
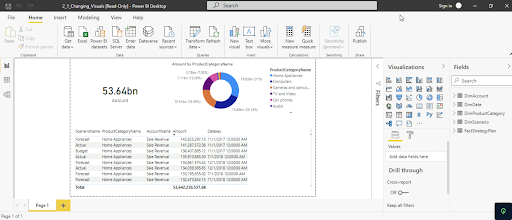
A chart in Power BI

A Tableau Visualization
Business intelligence is a practice that pre-dates the digital age. The first usage of the term dates back to the 1860s, referring to an American banker who gathered and analyzed data to gain actionable insights and get ahead of the competition.
Things have come a long way since then, with ever-increasing amounts of data being accessible for modern businesses. As a result of such an influx of data, various organizations have produced software to help businesses make sense of the vast swathes of information.
Tableau first launched in 2004, providing a drag-and-drop way for users to create interactive visuals and dashboards. In reality, Tableau has a variety of products that help businesses store, analyze, and visualize data.
Microsoft Power BI arrived on the scene several years later, first launching to the public in 2011. Again, the focus was to create an easy-to-use interface to enable non-programmers to organize and visualize data. Like Tableau, Power BI comprises several different components.
Let’s take a look at some of the ways Tableau and Power BI are similar:
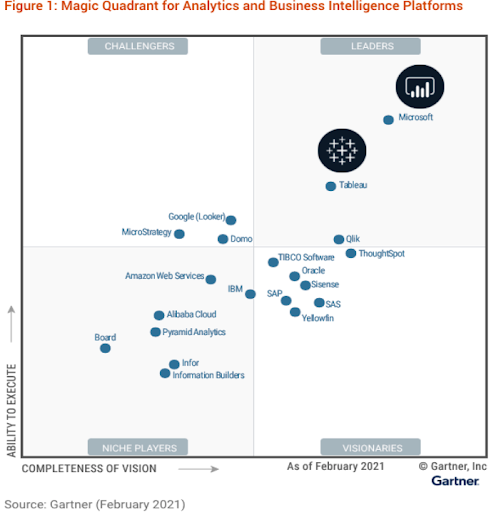
According to data from Gartner, Power BI and Tableau are the first- and second-most popular business intelligence tools on the market. With an average 4.4-star rating from over 2500 reviews, Power BI slightly outranks Tableau, which has 4.3 stars out of 5 from over 2100 ratings.
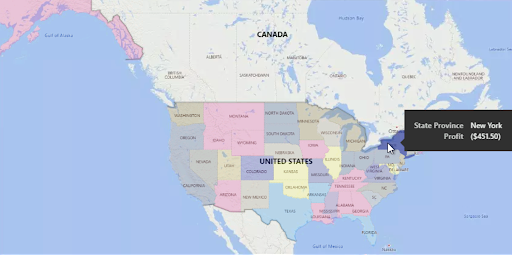
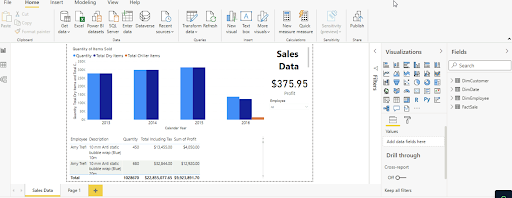
Both Tableau and Power BI can help you showcase your data in a variety of different ways. You have options for visualizations, including bar and line charts, treemaps, and geographical maps. On both platforms, you can interact with these visualizations, such as by hovering over them to get more information and applying filters, and you can also combine them to create interactive dashboards.

It’s one thing visualizing the data you have, but it’s important to have an array of inputs. After all, businesses tend to gather data from multiple channels. When comparing Tableau and Power BI, we see that both can connect to a wide range of sources. These include MS Excel, CSV, and JSON, and the paid version of both platforms gives you access to 50+ additional data connectors such as Google Bigquery, Amazon Redsift, and Salesforce. Visualizations are updated if the underlying data changes.
Part of the appeal of using business intelligence tools is that everything you need is at your fingertips. This makes both Tableau and Power BI ideal tools to learn if you are new to data analytics. If you are a business analyst, they are two of the main data visualization tools you will need to work with data.
Of course, there are other tools you can work with, as the graph below demonstrates. SQL, R, and Python are also valuable tools, and adding one or more to your skill set is extremely valuable.

Thanks to recent updates, Tableau and Power BI have become increasingly similar.
For example, Power BI used to excel in data preparation, as users have always been able to model, clean, and add calculated columns to datasets through Power Query. However, Tableau has recently made its own inroads with the launch of Tableau Prep.

When comparing, Tableau and Power BI, there are a few points of difference that you should consider, and if you are thinking about using them within your business or in your career, these can make the choice easier.
This can make the choice of the two platforms a whole lot easier. If you will mostly be using a Mac for your work, Tableau would be the better choice, as you can’t use Power BI on a Mac.
Tableau offers a wider range of options designed for specific professions. You can find out more about these on the Tableau website, but essentially, there are associate, specialist, and analyst levels.
Power BI has one certification that covers all the main functionalities of the platform. There is the PL-300: Microsoft Power BI Data Analyst exam.
Another key difference between certifications is that, while Power BI offers its exam in multiple languages, Tableau currently only offers its Certified Professional Exam in English. The Tableau Associate exam is available in multiple languages.
As Power BI was developed by Microsoft, it will be easier to integrate into your workspace if you use Office software. Likewise, Tableau was recently acquired by Salesforce so they are worth considering thanks to their native integration. However, both are capable of connecting to tools like Excel and Salesforce, so this is more a question of which would run more smoothly for your setup.
When it comes to using each with different programming languages, there are further differences:
It’s worth looking in more detail at the prices of these two business intelligence tools, as this is where perhaps the most differences exist between Power BI and Tableau.
As a quick reference, we’ve included these details in the table below:

| Name of license | Cost (monthly) | Description | Name of license |
Cost (monthly, billed annually) |
Description | |||||||
| Power BI Desktop | Free | Allows you to use all basic Power BI functions on your local machine | Tableau Public | Free | Can be used to create visualizations connected to Excel, CSV, and JSON files. All visualizations will be publicly viewable. | |||||||
| Power BI Pro |
$13.70 (free if you have Office 365) |
Provides access to individual users and enables them to build their own dashboards and connect to a wide range of data sources. | Tableau Explorer | $40 per user | Allows the holder to build dashboards and visualizations based on a dataset provided by colleagues. | |||||||
| Power BI Premium (per-user) | $27.50 | Similar to Power BI Pro, but has increased storage capacity, allows you to refresh dashboards more often, and offers some additional features. | Tableau Creator | $70 | Provides all Explorer permissions, plus the ability to create connections to data sources. Recommended for individual users. |
The licenses above are designed for individual data analysts who are creating dashboards. If your company is interested in rolling out Tableau or Power BI, you will also need to consider viewer licenses:
| Name of license | Cost (monthly) | Description | Name of license |
Cost (monthly, billed annually) |
Description | |||||||
|
Power BI Premium (per-capacity) |
From $6,858 | An enterprise-specific license that enables viewing access to everyone in your organization (a PBI Pro license is still required to edit dashboards). | Tableau Viewer | $15 per viewer | An enterprise-specific license that allows the holder to view dashboards created by colleagues and apply filters. Also offers custom enterprise subscription plans. |
Power BI and Tableau are both built to handle large amounts of data. Both tools have various storage and connection types. Some are built to handle large amounts of data, while others are built to ensure real-time dashboard updates.
However, Tableau tends to perform better than Power BI when it comes to significantly large data sets. Power BI is faster when data sets are more limited. Again, it depends on what you’re going to be using the tools for as to which is most suitable for you.
There is very little to separate these two when it comes to the UI and UX, only personal preference. Both are designed to be intuitive and easy to use, giving users the chance to explore their data in a way that feels familiar. You’ll be able to pick up either with similar levels of ease.
You’re probably wondering which comes up top in the Tableau vs Power BI comparison. However, in reality, the best choice is really up to the individual. It depends on your needs and what you’ll be using it for, as well as what’s required of your business.
If you are looking to upskill and enhance your value to potential employers, having a working knowledge of either Power BI or Tableau is great.
So, should you choose Power BI or Tableau? There is certainly a lot of overlap between the two, and ultimately both are useful tools to have. For some users, choosing to learn both can be the best option. However, for those who wish to decide between one or the other, there are differences in cost and accessibility that must be considered.
Think about the system you’ll be using it on, the amount of data you’ll be working with, whether you need to use programming languages with your work, and whether you want to become certified.
|
Tableau |
Power BI |
|||||
| Market leaders? | ✅ | ✅ | ||||
| Variety of different visualizations? | ✅ | ✅ | ||||
| Can connect to various data sources? | ✅ | ✅ | ||||
| User friendly? | ✅ | ✅ | ||||
| Type of machine it can work on? | Macs and Windows Computers | Windows Computers only | ||||
| Certifications? | Multiple | One | ||||
| Easier to integrate with... | Salesforce | Microsoft | ||||
| Cost | Varies, but Tableau is generally more expensive | |||||
Source: datacamp.com


