
- Training
- Service
- Promotion
- Schedule
- Testing Center
- News
- Contact


You may have heard of Power BI or seen great reports or had your mentor mention how it helps make informed decisions. I've had the opportunity to use this tool since I started as a data analyst, and with real-life projects, I've seen how important it is in helping turn raw data into clear and insightful information.
What Is the Purpose of Power BI?
Power BI is a leading business intelligence (BI) tool that helps organizations to mitigate risks by transforming raw data into precise and actionable insights. It is a combination of software services, applications, and connectors that work together to transform data from various sources into reasonable, interactive, and visually appealing insights.
All that said, BI and interactive data visualization are its main focus areas, and connected to this is the way in which Power BI enables you to connect to different data sources at the beginning of the process and then publish or embed those insights into your apps and websites.
Power BI can be understood as a collection of three connected components. These components are:
Power BI Desktop
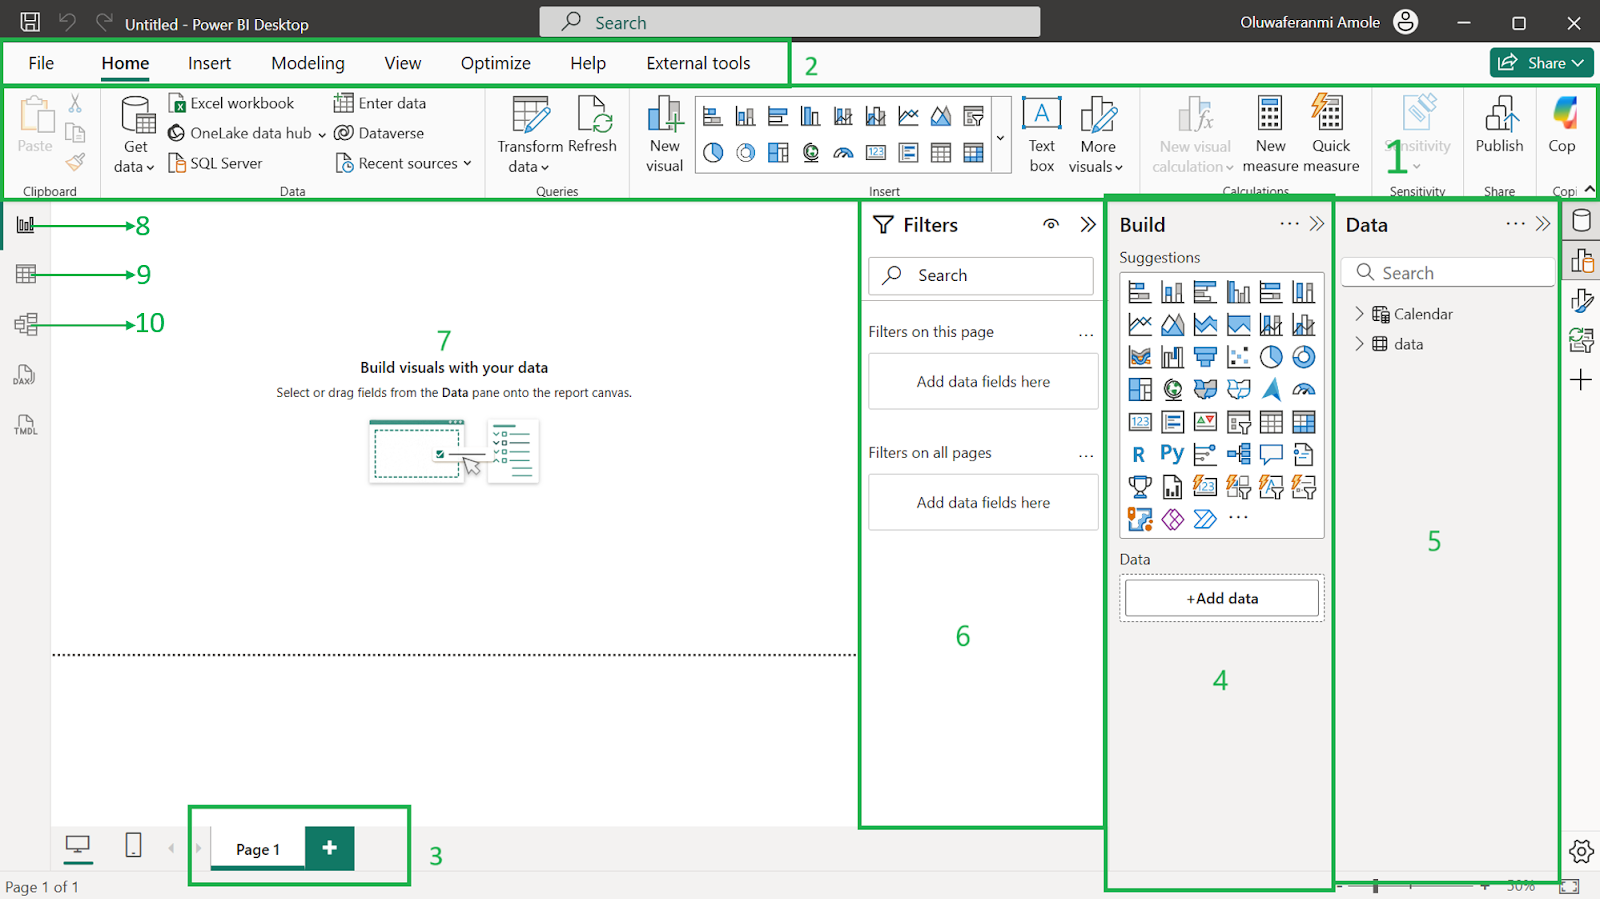
This is a free Windows app for building reports. You can connect to datasets, transform it, create models with DAX, and design interactive visuals. Key interface areas include the ribbon for tools, panes for visuals, fields, filters, and a canvas for building reports.
Power BI Service
Power BI Service is a cloud platform where you publish reports from Power BI Desktop, build dashboards, share insights, and collaborate. You can also create reports directly in the service, especially when connecting to tools like Salesforce. Features depend on your license type.
Power BI Mobile
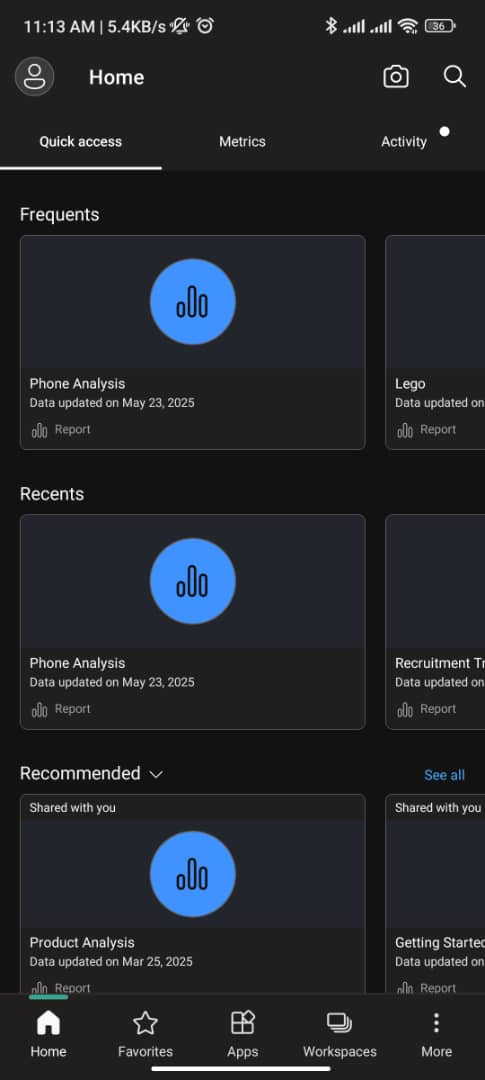
Power BI Mobile lets you access and interact with reports and dashboards on iOS, Android, and Windows devices. Favorite and recent dashboards refresh in the background when online—every 2 hours on Wi-Fi, or every 24 hours on mobile.
How Does Power BI Work?
Power BI operates based on a well-defined workflow. It begins by connecting to data sources, followed by transforming and modeling the dataset using an in-built tool called Power Query Editor.
Once the data is prepared, you then create reports filled with visuals. The final step involves publishing these reports to the Power BI service. There, you can share reports with stakeholders, set up scheduled refreshes, and utilize them for collaborative decision-making. This process is iterative, allowing you to easily move between data transformation, modeling, and visualization to refine insights.
Connecting data sources
The first step in the Power BI workflow is for you to establish a connection with your dataset. You can connect to various file types like Excel, CSV, JSON, PDF, and Parquet, whether stored locally or in SharePoint.
Power BI also integrates with both relational and non-relational databases, including SQL Server, Oracle, MySQL, Google BigQuery, and Snowflake. Power BI also offers strong connectivity to other Microsoft ecosystem products, such as Azure services (Blob Storage, Data Lake), Power Platform sources (Dataflows, Dataverse), and the new Microsoft Fabric Warehouses and Lakehouses.
Data transformation and modeling
After getting Power BI connected to the necessary data sources, the next step is the data transformation and modeling process.
The Power Query Editor makes it easy to perform common data preparation tasks through a user-friendly interface. Behind the scenes, it uses M language to apply these changes efficiently.
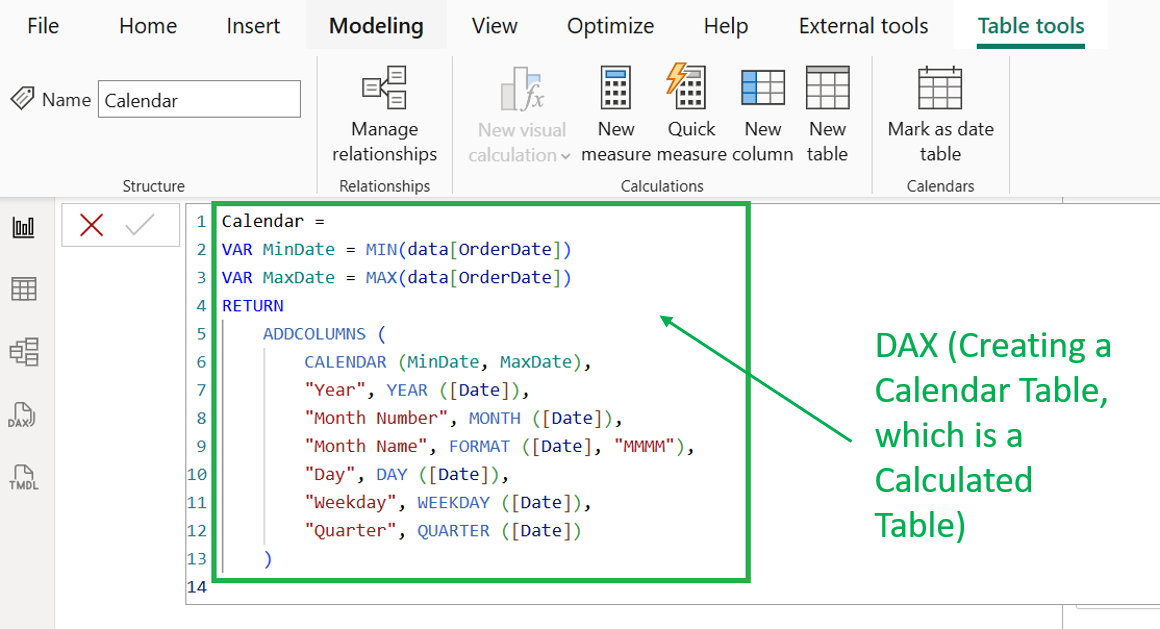
Once the data is prepared, users can define how different tables relate to each other through data modeling, making it easier to analyze information across sources. Power BI also includes DAX, a formula language used to create custom calculations and metrics for deeper insights.
Creating visualizations and dashboards
Once you have established a connection with your dataset, transformed it, and created a model, the next thing is to tell a story with your dataset to ensure that stakeholders understand complex information at a glance, which will, in turn, drive the informed decision for business growth and one way to do that is through a collection of compelling visualizations to create a dashboard.
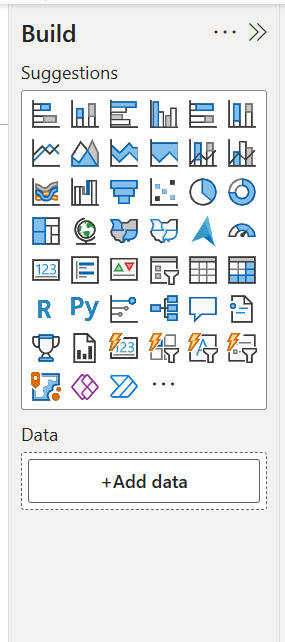
Power BI supports a wide range of visualizations, from standard charts like bar and pie to advanced ones like decomposition trees, KPIs, maps, and custom visuals from AppSource. You can build interactive reports using a drag-and-drop canvas in Power BI Desktop, with features like slicers to filter data across multiple pages. To design for impact and user experience, it’s important to choose appropriate visuals, organize them clearly, and use formatting and color purposefully to guide users toward key insights.
Collaboration and sharing
Once you've completed creating your dashboard, the final step is to share the dashboard or report with stakeholders. Here are some options:
If you are wondering about security, Power BI secures datasets using features such as workspace roles and Row-Level Security (RLS), which restrict access to datasets based on user roles. Your ability to share and consume content is highly dependent on your Power BI license type.
Using Power BI Features
Power BI offers a wide range of advanced features, including dataset integration, advanced analytical calculations, AI-driven insights, and flexible deployment options. Even though these features sound and are advanced, they are also still accessible to beginners.
Data integration and transformation
Power BI can handle extract, transform, and load (ETL) process through its Power Query Editor. Power Query Editor provides a user-friendly interface for cleaning and transforming your dataset through various actions, which are recorded to ensure repeatability in the data preparation process. Basically, with it, you can connect to lots of different data sources.
Advanced analytics and AI features
Another important feature is DAX, AKA Data Analysis Expressions, which I mentioned earlier. DAX is a formula language used to create custom calculations and complex metrics.
Embedded analytics and mobile optimization
Through Power BI Embedded, organizations can integrate interactive reports and dashboards into their custom applications or websites. Power BI also has a mobile app so you can access and interact with datasets on the go. Reports previously viewed on the app are available even without an internet connection.
Limitations and Considerations
Power BI has some limitations, ranging from performance issues when working with large datasets, which slow down refresh times. However, alternative data connection modes exist to mitigate these issues. The effectiveness of analysis is also dependent on the quality of the underlying dataset. Inaccurate or inconsistent datasets will lead to unreliable insights. Additionally, Power BI is not fully available on Mac; it's mostly only compatible with the Windows operating system.
New Ways Power BI Is Being Used
Power BI is keeping up with the AI revolution. Power BI now enhances the developer experience by assisting with the data analysis process. Specifically, more and more, Power BI is automating insight discovery, identifying trends and anomalies, and generating narrative summaries to make even the more complex datasets understandable. One of the more exciting recent additions is Copilot, which allows users to ask questions and receive answers as dynamic visuals. AI also helps in generating and explaining DAX expressions, which reduces the learning curve and improves report development.
Source: datacamp.com


