Tan Duc ITS successfully deployed the course "Excel Expert Skills 2016"
7/22/2019
Tan Duc has successfully implemented the Excel 2016 Expert Skills course - MOS level for International Universities at HCMC.
After completing the course, students will do the following requirements:
- Use Filter to display only the records that meet criteria you specify. You can filter by text, numbers, cell color, font color, or icon set, blank or non-blank.
- Quick Analysis provides a simple way to do simple things. All of the feature provided by Quick Analysis are also available (usually with more options and features) by using the Ribbon. Help you to save time when adding simple totals to ranges. Quick Analysis is also able to add more complex functions to compute Running Total and % Total.
- Use Sort data helps you quickly visualize and understand your data better, organize and find the data that you want, and ultimately make more effective decisions. You might want to put a list of names in alphabetical order, compile a list of product inventory levels from highest to lowest, or order rows by colors or icons
- About tables, how they differ from ranges, and how to use them effectively to manage data, and structured references that provide a completely new way to reference dynamic table data. When you designate a particular range of worksheet data as a table, its formatting is extended when you add data and all table formulas are updated to include the new data.
- Use the Text To Columns command on the Data menu to put each record in a separate column. The range that you convert may contain many rows, but you can only convert one column of data at a time.
- Use Subtotals to summarize data in a worksheet. You can also use multiple subtotals to summarize the data. You can create subtotals for more than one type of calculation by using various summary functions, such as Sum, Max, Min, and Average.
- Use Consolidation feature to summarize data from different worksheets.
- You will able to confidently explore the vast array of other functions in Excel’s huge library should you ever need them
- Use names to make your formulas easier to understand and easier to modify the place of references in formulas.
- Use names, validation, intersection operator and INDIRECT function to get information.
- Use Names and OFFSET function to create dynamic formula-based range names.
- PivotTables feature lets you summarize selected worksheet data in an interactive table format. You can freely rearrange, or “pivot”, parts of the table structure around the data to summarize any data values within the table by category. You can also view data three-dimensionally, with data for each category arranged in a stack of pages. Excel includes two PivotTable features: PivotTable reports and PivotChart reports.
- Use Goal Seek, you specify a solution, then find the input value that produces the answer you want. For example, you can use Goal Seek to determine how many units must be sold to reach a particular sales goal or to determine what expense levels are necessary to meet a budget target.
- Use Views are sets of worksheet display and print settings that you can save. You can create multiple views for a worksheet and switch among them to change the display of the worksheet.
- Apply password protection to a worksheet, protect parts of a worksheet, and protect a workbook
Course outline: Excel Expert 2013/2016
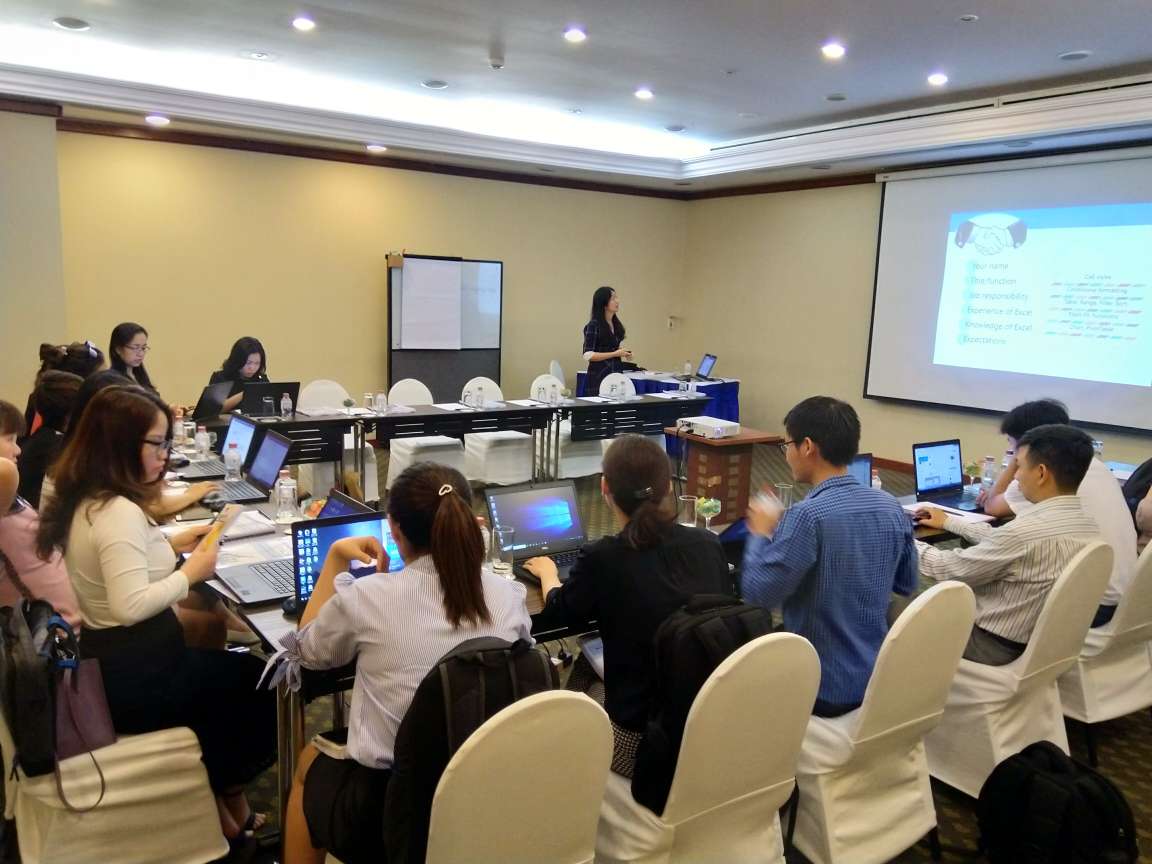
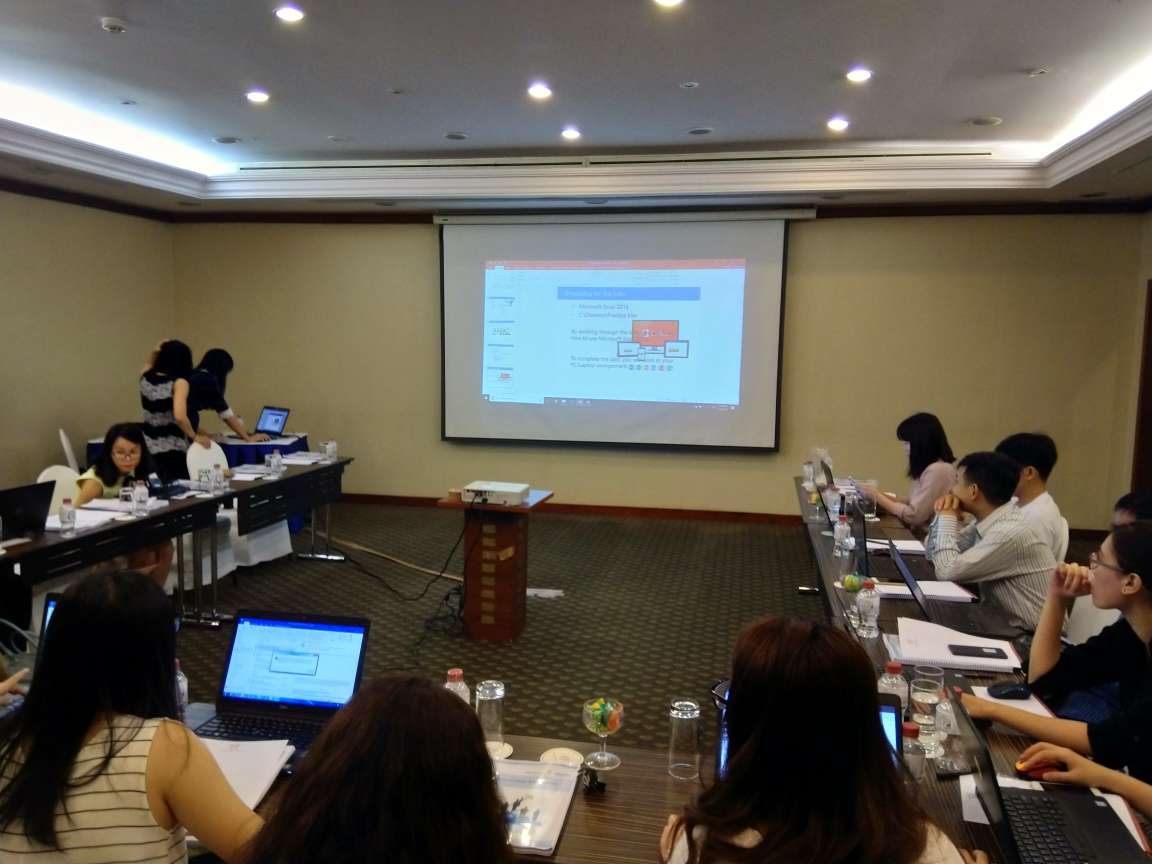
Here are some images about this training:
See more