
- Training
- Service
- Promotion
- Schedule
- Testing Center
- News
- Contact
11/14/2022


Learn everything you need to know about how to create a dashboard in Excel, with tips and examples.
A dashboard is a compact visual representation of data. Dashboards are designed to be eye-catching, easy to understand, and concise so that users can quickly extract insights.
Dashboards can contain raw numbers, tables, and charts. However, dashboards become powerful tools when they incorporate visual elements to enrich the information they convey, such as through colors, charts, and conditional formatting.
Dashboards can be used in nearly every industry and business use case. They are a tool for improving the business's decision-making process and can perform complex data analyses.
Here are a few reasons why dashboards are so useful in organizations. They allow you to:
To build high-value dashboards that people in your organization actually use, first start with a strategy. You need to know beforehand why you're building this dashboard, who you're building it for, how it will be built and how you will distribute it to your users.
The dashboard strategy process can be summarized into these five main components:

Knowing all of this before you start building your dashboard will save you more time and headaches later on because you will build what is actually needed and you can avoid entering revision hell or getting negative feedback because you built something that the business didn't actually need.
Clarity is your best friend when building dashboards. Let's review how you can gain clarity with these dashboard strategy components.
Be clear on why you need this dashboard - what are the goals? Is this dashboard answering a specific business question or solving a particular problem?
Sometimes, the departments in an organization may already have one or more goals in mind for the dashboard. They may have a task to complete and know that a dashboard would help them do their job better.
However, other times business users don't know that a data-driven approach is even possible or useful to them. In these cases, you or your manager may need to look out for possible areas where a dashboard can add value to the business and propose it as a solution. Here it is even more important to clearly define the purpose and goals of the dashboard before you start building it.
In this step, you identify who this dashboard is intended for. Find out who your targeted audience is and what their goals are when they look at the dashboard. Is it for detail-oriented finance managers who want to see a lot of detail or for C-level executives who just want a high-level overview of the business KPIs?
Knowing your audience is an important prerequisite for answering the questions in the next few sections of your dashboard strategy.
What data will you be using? Is the data already available in a database or a flat file that you can simply import into Excel for your dashboard? Or do you need first to extract and prepare the data?
Also, understand how much data is needed. Do you need large amounts of historical data, or are you dealing with more recent events?
Does the data need to be cleaned and transformed before you can build the dashboard? Do you need to check for errors or remove duplicates? This is usually the case for newly extracted data, and data obtained from a database would typically already be transformed and ready to use.
How often do the data and the dashboard need to be updated? Flat files tend to lead to static dashboards, whereas database connections using ODBC can be updated when needed and lead to dynamic dashboards.
You can identify the best layout for your dashboard at this stage. The previous stages of the dashboard strategy will inform this step. You already know why you're creating the dashboard, who it's for, and the details about the data that will be used.
Also, determine if the dashboard needs interactive elements so users can explore the data and diagnose and investigate possible business problems themselves. Or, if the dashboard will be used to create PowerPoint presentations, it can be more static.
How will you be sharing the Excel dashboard with your intended audience? There are a few options for sharing Excel files, such as attaching it to an email, saving it to a shared OneDrive folder, or exporting it to a PDF.
Keep in mind that these methods (except the export to PDF) give users the ability to edit the dashboard and the data. If you don't want anyone to be able to make changes, you can protect the workbook and lock the cells using a password. Or, you force the workbook to open in read-only mode.
Follow these simple best practices as you design and create your dashboard:
This step-by-step guide takes you through the process of how to create an Excel dashboard from scratch.
In this fictional scenario, imagine you work for a financial services firm. Your task is to help the marketing department better understand how their campaigns are performing, particularly their most recent campaign. They have sent you the data in a CSV file and have asked you to prepare a dashboard for them.
Specifically, they would like to answer these questions with this dashboard:
Go ahead and open a blank Excel workbook and start by creating two sheets named 'Data' and 'Dashboard'.
Since the marketing team sent us a static CSV file, we will import it into our Excel workbook by copying and pasting it into the 'Data' sheet.
I have also selected "Format as Table" so that Excel regards this data set as a table. Other than making the data look nice, it adds some functionality, too, such as referencing column headers by name in formulas (instead of referencing the column letter).

Note that you can find all other controls involved in importing data on the 'Data' tab of the ribbon.
During this step, you will transform, prepare, and clean your data, so it's ready to use in the dashboard. You should also spend some time on the calculations you will need for your dashboards. Excel has hundreds of functions and formulas that you can use to build the calculations you need.
We have finally reached the dashboard-building stage. You need to choose which visual elements you will use in your dashboard to achieve the goals you set out at the start.
This dashboard has three major elements based on the goals that the marketing department set out for us. These are:
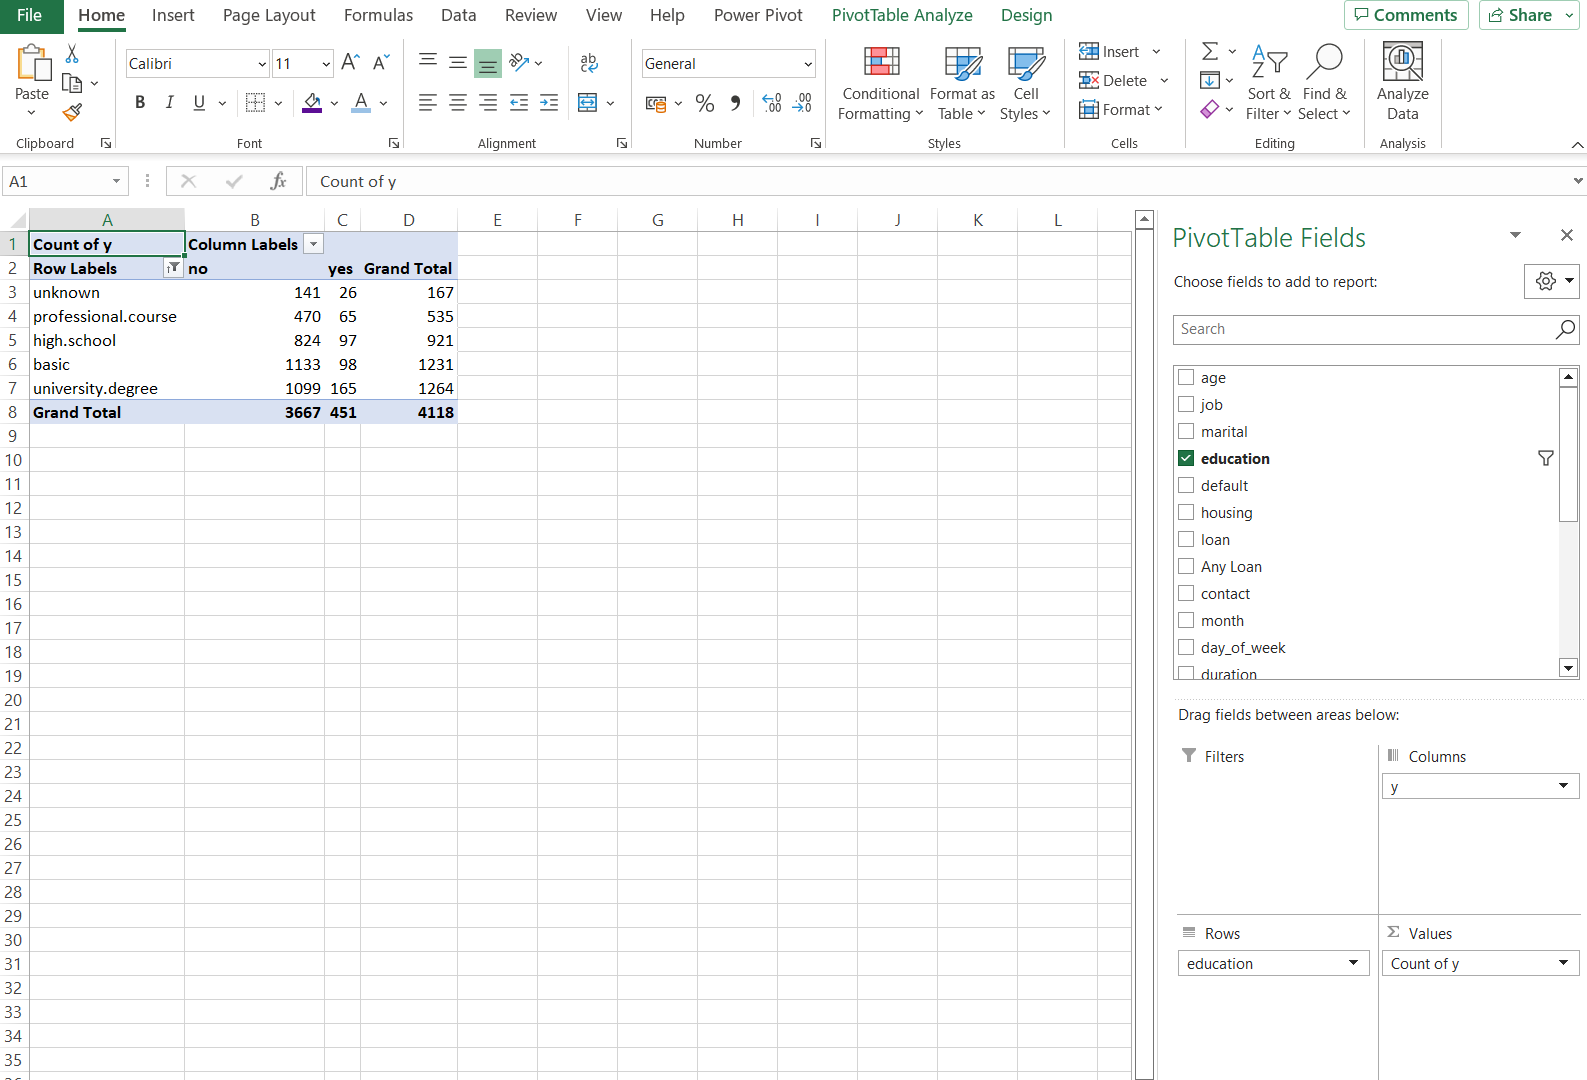
We won't go over how to create every chart in Excel as it is quite repetitive. However, this is the process you would usually follow:
Here is the final result of the example Excel dashboard we created.

Now that you know how to create a dashboard in Excel, you should have the confidence to present your data with impact. Whether you’re starting out with a simple excel table or data source, you can use the skills learned here to turn raw data into something meaningful.
Learn more about our Microsoft Excel Dashboards and Reports – Advanced Skills training course.
Source: datacamp.com

12/11/2025


